The international scientific and analytical, reviewed, printing and electronic journal of Paata Gugushvili Institute of Economics of Ivane Javakhishvili Tbilisi State University
The Analysis of Income Distribution in Georgia Based on Simon Kuznets Methodology
Expanded summary
The research reported here is taken from my Master’s Thesis “Macroeconomic Policy of the Inclusive Economic Growth” which I successfully defended at Ivane Javakhishvili Tbilisi State University in July 2018. It’s the part of the third chapter of my thesis, compressed and refined for being published. (Special thanks to the Doctor of Economics, Professor and my thesis supervisor Mr. Nodar Khaduri who made a great contribution with his critical remarks and advices)
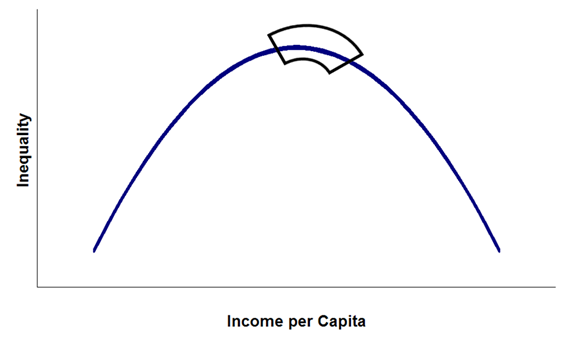
The major aim of the article is to analyse the income distribution in Georgia by Simon Kuznets methodology and to depict the final result on the Kuznets Curve. The Kuznets Curve is still actual in the modern economic theory. It reflects the concept of how economic growth affects the inequality[1] and, since there are not many enquiries about that subject and the Kuznets theory is still authentic looking at empirical data,[2] it remains as a major concept of the underlined connection.[3] Georgia hasn’t gone through the natural and stable way of economic development in recent centuries what was done by western developed countries. The development of Georgian economy was forcibly obstructed and then abruptly became sovereign in 90s of the twentieth century, since then, both simultaneously but not one after another, the industrial and the post-industrial developments are in progress. So, we should not expect that Kuznets Curve will be perfectly replicated in Georgian economy. In the research below I will try to explain the recent income distribution tendencies in the economy of Georgia according to the Simon Kuznets ideas and draw an outline of the most possible future scenario. (There is always National Statistics Office of Georgia wherever the source of data is not indicated)
The Kuznets Curve consists of increasing and decreasing parts with the bending interval between them. One of the first idea articulated by Kuznets about the inequality is that excessive share of the total income in hands of highest-income quantile (20%) of the population is the reason of a high inequality in the developing countries. The middle 3 quantiles are close to the lowest quantile while the top quantile is much higher with it’s income share than the 4th quantile. That means the country has not the strong middle class. Let’s see the distribution of income in Georgia. I collected the data about household incomes from the National Statistics Office of Georgia website (the data is from 2009 to 2016), sorted it in ascending order, formed the 20 % quantiles and got the picture which fully approves the mentioned idea. In 2009, the distribution of the total income between 20% quantiles was 4.20%, 8.89%, 14.23%, 22.58%, 50.10%. In 2016 it was little bit better in terms of equality but only slightly. The top quantile is still a way above the other quantiles.
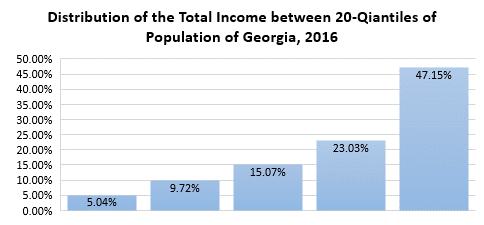
The little improvement towards the equality from 2009 to 2016 was driven by different pace of average income growth between quantiles.
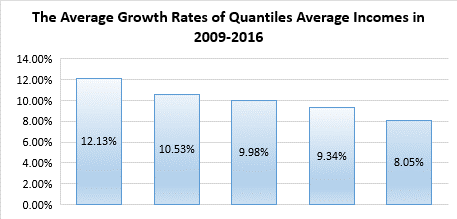
As lower quantile we look the higher growth rate it has, that’s the ideal arrangement for inclusive economic growth. Here is the chart representing the annual growth rates for 1st and 5th quantiles during that period.
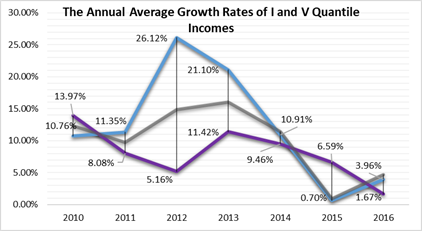
As the chart shows, the best year in terms of improvement towards equality was 2012, when the lowest quantile income increased by 26.12% while the top quantile income by only 5.16%. In that year, poverty rate in Georgia dropped from 34.1% to 30%. Hence, it was the most successful year for inclusive development with that two improvements.
However, those improvements can’t be relieving for the poor people in Georgia. In absolute terms the top quantile average income went up by 851 GEL while the lowest quantile average income increased by only 118.61 GEL. Their average income is 9 times lower than the highest quantile average income. Therefore, not only the correct arrangement is enough but also higher difference in growth rates is needed.
To compare Georgian economy with the economy of about our level, the good example is Moldova which is on 31th place in the Inclusive Development Index ranking for developing countries. Georgia is on the 32th spot in that ranking.[4]
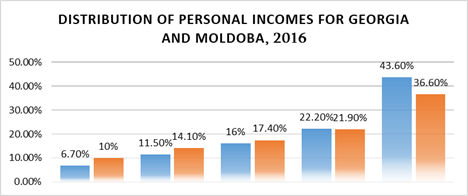
The chart demonstrates the difference between Georgian and Moldavian distribution of personal incomes. It’s apparent that Moldova (orange bars) has much more equal distribution between it’s quantiles than Georgia (blue bars). Although Moldova is 2 times lower real GDP per capita country than Georgia (4084$ to 2063$ in 2016, 2010 US dollar), their income distribution is bright example of how developing country can have the high equality. Exploring their economy I found out that service section share of GDP from 24% in 1989 became 64.8% in 2017. That is another crucial idea of Kuznets. Rising share of service section in economy will lead to the decreasing inequality in long term. Georgia has to press on that factor.
Moreover, according to Kuznets, the emergence of the new industrial system has shattering effects on long-established pre-industrial economic and social institutions. Indeed, Georgia suffered it’s growing phase of inequality in 1990s when Soviet Union was finally abolished and the country became a sovereign republic, where new institutional system was established. That led the economy to the increased inequality.
According to the Kuznets numerical illustration, the turning point of the curve comes when the half of the total population is settled in cities given that proportion of average incomes between agriculture and all other sectors is 1:2. Since the proportion in Georgia was 1:1.35 in 2016. That numbers highlight the industrial and post-industrial underdevelopment of Georgia. In 2018, 58.3% of Georgians are living in urban areas of country. With simple calculations, and considering the widening gap between the average incomes of agriculture and other sectors, also predictions about high economic growth, I assume that 60% settled in urban areas will be sufficient for turning point for being activated and that time will come in 2025.
Also, I want to stress on the fact that Simon Kuznets analysis was about 19th and 20th century tendencies when that each phases were continued for about 60 years. Today, in a modern, globalised and hectic world economy we should not assume that the country needs still 60 years to overcome the inequality growth phase. In Georgia’s case, the inequality rising phase definitely shouldn’t last until 2050 (from 1990s).
We talked about the first (inequality rising) and turning point phases. Now about the last phase which is the inequality decreasing phase of Kuznets Curve. The factors of that phase are barely realized in Georgian economy for now but the time for that is not far. The first factor, according to Kuznets, which leads to increase the income inequality is demographic. Usually poor people have more children then rich people. Therefore in long term the quantity of the rich people who were rich years ago shrinks and the quantity of relatively lower-income people raises. That means that over the time top quantiles are fulfilled with previously lower quantile people. Hence the inequality diminishes.
The second and third factors of decreasing inequality are dynamism of economy and increased share of service section in GDP. In Georgia there are some structural changes indeed. If in 2006 the highest-share sections in GDP were government driven sections, now there are the trade, industry and transport sections on top of the list in 2017. The dynamism of economy creates good chances for lower-income people to settle themselves in the market. The service section is enhancing over time in Georgia as well. The share of the sector and the average income of the sector are both increasing. That creates opportunities for the ordinary people who are without a massive heritage or other privilege to gain high income with their professionalism and commitment. Hence it lowers the inequality.
The most important factor according to Kuznets is the strengthening of middle class, thus middle 3 quantiles. The 58% of the Georgian population lives in urban areas of country in 2018, that means the 50% barrier was prevailed years ago (in 1969, based on growth pace). Therefore the adaptation of the middle class should be over for now and strengthening process is already started. The political power in the hands of middle class is very important too. The fact that in 2017 9.11% of the GDP was directed to the health care and social security is the proof of middle class political influence.
There is the graph of the difference between lowest and top quantile shares from 1996 to 2016 in average personal income per quantile.
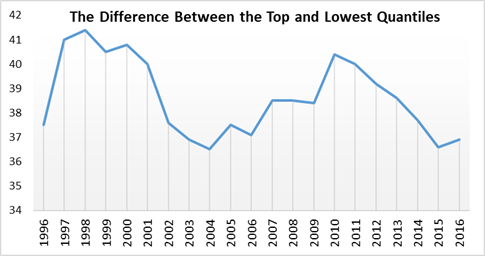
There are two phases of inequality growth: from 1996 to 1998 and from 2004 to 2010. Both of them happened during the political and institutional changes what confirms the claims of Kuznets. The downward oriented stretch between that two increases can’t be explained as a start of final phase of Kuznets curve because the two phases don’t follow each other in a such short period of time. But the interval after 2010 can be the phase of activated turning point.
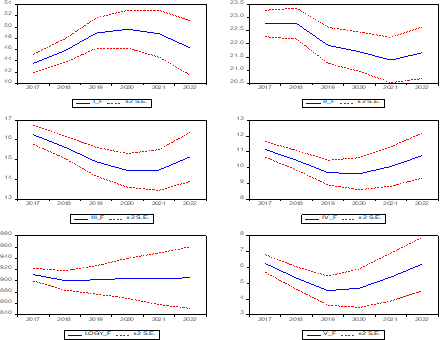
I made VAR model in for further analysis of that subject. There I found that the only significant impact GDP per capita has on lowest quantile share and that connection is positive. Also, I made a forecast for the mentioned variables: quantiles and GDP per capita growth. As you can see the lowest quantile share has a little downturn until 2019 and then goes up again. That’s because it is strongly depended on GDP per capita growth which has it’s little drop as well. But if we consider the policy measures the government of Georgia implements for inclusive growth that slump can be avoided.
Finally, considering the factors I mentioned here and VAR analysis and forecast of the inequality I assume that the final phase of the Kuznets Curve in Georgia started in 2010 (from whence the reducing of the difference started, see the graph), or after little swings it starts from 2019 and in 2025 will be in an active final phase.
[1] Simon Kuznets - Economic Growth and Income Inequality, The American Economic Review, Vol. 45, No. 1 (Mar., 1955), pp. 1-28
[2] Robert J. Barro - Inequality and GrowthRevisited, January 2008
[3] Alfredo Saad-Filho – Growth, Poverty and Inequality: From Washington Consensus to Inclusive Growth, November 2010, Economic & Social Affairs
[4] World Economic Forum – The Inclusive Development Index 2018, Summary and Data Highlights